CHIRPS Reality Checks
CHIRPS v2.0 monthly Reality Checks
CHIRPS Reality Checks (rchecks) occur across the many steps to create CHIRPS and on the final product itself.
Contents
Background
A team of data analysts routinely quality check each month’s CHIRPS data before its release. This page documents major points of these Reality Checks. Rchecks country highlights has information that CHIRPS users may find helpful, for example, notes about major rainfall anomalies in the data. Notes on Rchecks resources is information for CHG to continually improve the Reality Checks process.
Rcheck is a hands-on approach that helps enable a quality product for hazards monitoring and other scientific activities. In Reality Checks we examine the data visually via the Early Warning Explorer and separately using calculated statistics. Ancillary information, such as FEWS NET datasets, news reports, and government meteorological reports, are frequently used in the process. Rchecks has been successful in: 1) Validating anomalous wet and dry events around that world as shown by CHIRPS, 2) catching inaccurate station reports that would have otherwise negatively influenced the dataset, such as creating false droughts, 3) checking that the semi-automated flow CHIRPS data creation is working correctly, 4) identifying weaknesses and strengths of the algorithm and data inputs, which helps in planning improvements in future versions.
Historic vs Operational rchecks
There are two basic types of rchecks: historic and operational.
- Historical: Historic looks across the whole timeseries of CHIRPS (1981-present)
- Operational: Operational is designed to spot check our products are they are produced.
- Does this station value fall within expected range?
- Do the anomaly fields have a reasonable distribution? (not all negative)
View individual stations time series
- The center pixel of the station's 11x11 pixel representation is assigned the anchor station's sequence number in the CSCD1 database. Clicking on this pixel in the EWX will list the seqnum in the lower left corner of the map pane. Note that this may not be the station that was actually used if there was missing data and a nearby station filled in the value. The source seqnum of the station can be obtained with the follow SQL command:
- select * from station where seqnum=xxx
- then the source seqnum can be used to get the name of the source like this:
- select * from source where seqnum=xxx
- then precipitation table can be selected from the following list of precip tables:
- daily_precip_conagua
- daily_precip_fgsod
- daily_precip_fits
- daily_precip_ghcn
- daily_precip_ideam
- daily_precip_sasscal
- then the following command will return the station time series:
- select * from daily_precip_sasscal where station_seqnum=xxx order by date desc
- Note that the filled value is the precipitation value that is used in CHIRPS. This is the sum of the daily "value" column with any missing data filled in with the mean of the values that do exist in the table.
Helpful Links
The following may be helpful links in completing the monthly reality checks:
- Global NOAA Climate Products: Choose zone of the world for special products (Central Asia, South Asia, Africa, Central America & Caribbean)
- Global FEWS Data Portal
- Africa FEWS Archived Hazards/Threats
- Ethiopia NMA Maproom
- Central America FEWS Archived Hazards/Threats
- Brazil INMET: Click the Mapas de Precipitacao tab and then the Plus button at the bottom of the map and an end date and time period can be selected (30 dias).
- Argentine Servicio Meteorologico Nacional: Click on Precipitacion Observada or Precipitación Estimada links.
- WMO Links to other National Met Services:
April 2016
Rchecks highlights
Central America Dry along Eastern coast of Costa Rica and Panama. Station on S. coast of Panama shows anomalously high value but seems to match with TRMM [1]. Weather underground report says in April it got 4.59 inches, or 116 mm [2]. Didn’t have visual impact on CHIRPS so can leave it.
![[1]](http://www.cpc.ncep.noaa.gov/products/international/trmm/trmm_Apr2016-Apr2016_car_anom.gif)
United States April was the record wettest in southern plains, and the record warmest in northwest; [3];CHIRPS shows this very clearly. Station near Wichita Falls, Texas was permanently thrown out as it showed a super dry anomaly in the middle of very wet anomalies, and has historically given anomalously low values [4]. Station near Jarbidge, Nevada reported a high positive anomaly (138.0 mm) where adding up the daily rain amounts gives us 56mm [5]. Topographically, however, it could make sense, so it goes on the watchlist but isn’t thrown out.
Tanzania, south eastern Kenya, Uganda, South Sudan CHIRPS shows above average rainfall over large areas of the region, with April values 100-200 mm above average. Kilimanjaro (TZ) shows 400 mm above average. CHIRP and ~15 stations contributed to these data. Extreme rainfall was reported in many of these areas. Some of the most damaging events were in Nairobi and Mombasa (KN), Kasese and Kampala (UG), Mbeya, Zanzibar, Kilimanjaro, and Morogoro (TZ).
Angola There is a station on the West coast just inland of another station that shows half the value of the coastal one. The station seems to be anomalously low for flooding reports in the area and the values CHIRP assigns to the area. It is on the watchlist.
Madagascar Tropical cyclone Fantala skirted Madagascar’s northern coast, resulting in the extremely high station value [6]. There is another station on the SE coast that reported a high value where CHIRP reported low values-it is now on the watchlist.
Ethiopia There is a station in the NW of the country that is reporting a high rainfall value in the middle of very low values; it doesn’t have an impact on the final CHIRPS product, but will go on the watchlist to see what happens next month.
Chile Two stations, CHIRP, and CHIRPS final show above average rainfall in the Santiago area. Anomalies are 20-100 mm, which put rainfall in the 95th percentile (2+ standard deviations from the April mean). Floodlist reported that heavy rains and floods in Santiago left 2 people dead and 10 missing
Southern Brazil, Uruguay, Eastern Argentina CHIRPs final, from support by 30+ stations and CHIRP showed rainfall anomalies of 150-300mm in this region. CHIRPS totals in south Brazil are similar to INMET April accumulations (150-500mm). Link to report CHIRP shows a SE-NW oriented swath of heavy rain. The heavy rainfall was associated with several extreme events through the month, with greatest impacts in Uruguay. In early April, Argentina media reports claimed that over 500 mm of rain has fallen in some areas, including Alejandra in Santa Fe, San José de Feliciano in Entre Ríos, in the space of 4 days. Uruguay River rose to concerning levels. Then in mid April, more heavy rain occurred in Uruguay (150-180mm in 24 hours) and was accompanied by a tornado. 7 people died and 3,000+ people were displaced. Continuation of the severe conditions led to more flooding and displacement of 10,000 people.
Brazil Below average rainfall for much of the country (exceptions are south and north regions). CHIRPS shows rainfall as 25 to 75mm below average for most areas, with enhanced deficits (up to 150 mm anomalies) in States of Tocantins, Maranho, and Para. This general pattern is similar to the anomalies shown by INMET, Brazil’s Instituto Nacional de Meteorologia: Link to map
Australia While mostly dry, there were some moderate rains (more rain that usual - ~10-20 mm more on average) in Western Australia. [7]
South East Asia Despite an overall drought across South East Asia[8][9], Papua New Guinea experienced higher than normal rain in the north [10]. CHIRPS shows more precipitation in Indonesia (Sulawesi Selatan and Kalimantan Barat) than CHIRP alone, although not significantly above average.
Eastern China & Southern Japan Heavy rains in China and Japan are reflected in the CHIRP as well.[11][12]
Taiwan EWX classifies Taiwan as China (likely due to GAUL) - worth noting that while the PRC would be happy with that classification, Taiwan would not.
**Reality Checks update** Several station reports were removed from CHIRPS final product for April 2016. A list of these stations can be found on the Station WATCHLIST (link under Helpful Links at top of page)
March 2016
Rchecks highlights
Somalia CHIRPS has 50 new stations reporting rainfall observations in Somalia, thanks to FAO SWALIM. Previously, CHIRPS relied on satellite information (CHIRP) and influence from stations in the general region to give information about Somalia rainfall. The new stations were helpful in portraying how Somalia's MAM 2016 rainy season began. Parts of southern Somalia began with negative March anomalies of ~20 mm. This is corroborated by analyses based on other data that indicate poor March and April rainfall in the region. See FEWS NET Hazards Report and discussion below for more information. Another benefit of the Somalia station addition is that some stations contributed information in northeast Kenya (shown by the March decorrelation distance map in EWX).
Kenya, southeast Uganda, northern central Tanzania CHIRPS shows below average rainfall by 25 to 50 mm, with some areas like Kilimanjaro (TZ) up to 100 mm below average. General agreement with ARC2 March anomalies. A station near Kilimanjaro at Moshi (37.1E,3.4S) reports only 13 mm rainfall in March, with an anomaly of -90 mm. The exception to CHIRPS and ARC2 agreement is central TZ, where ARC2 shows average to slightly above average and CHIRPS shows average leaning to below average. In that area CHIRPS uses two stations (32.8E,5S and 35.7E, 6.2S). These report anomalies of -32 mm and 9 mm, respectively.
Ethiopia The pattern for March rainfall anomaly looks similar to NOAA's ARC2 and Ethiopia NMA Maproom data. March rainfall was below average by 25 to 50 mm across southwest to north central Ethiopia. A minor difference between Ethiopia NMA data and CHIRPS (and ARC2) is that Ethiopia data shows slightly above average rainfall in areas along west boundary with Sudan and South Sudan.
South Africa and Lesotho Near Lesotho and Free State (South Africa), several stations report low values that are below average. ARC2 shows similar below average March rainfall in these areas.
Angola SASSCAL station at 13.4E, 14.8S reported much higher rainfall value than its neighbor. Happened in Feb 2016 also. Checked and explained by topographic gradient (~1000 m higher than its neighbor).
Namibia SASSCAL station value at 17.3E, 20.4S removed due to reporting 0 mm next to neighbor station report of 72 mm. Same issue occurred in Feb 2016. Station is now on watch list.
Brazil Southeastern Brazil, along the coast, received very heavy rainfall, leading to flooding [13]. In general, the Amazon got more rainfall this month than it has in past months – however some of the values are suspiciously high. INMET, the Brazilian met agency, reports values closer to 300-400 mm, but CHIRPS is reporting values 400-700 [14]. There are two stations in the Amazon that drove this value up, both due to our own methodology – both stations had several days missing and we interpolated the values. One station (seq num 205630) reported 618mm but we filled in 709mm; the other (seq num 205638) reported 608mm but we filled in 650mm. We recommend taking out a different station in Brazil, in the north east (seq num 21432). This station has historically been lower than it should and significantly alters CHIRP into lower CHIRPS values. This month, the value was 21mm, surrounded by 200-400mm. The area should be wetter in the final CHIRPS. This station report was removed from CHIRPS March 2016 and the station is now on the watch list.
Columbia The round egg-shaped feature is still in Columbia, an artifact of smoothing with the station value. There are also quite a few stations reporting 0mm along the northern coast, backed up by other station data [15].
![[15]](http://www.cpc.ncep.noaa.gov/products/international/gts/gts_30day_sam_prcp_rep.gif)
Peru CHIRPS reports a lot of rain in the north, not backed up by TRMM [16]. However, flooding reports back up CHIRPS in catching this flooding event [17].
![[16]](http://www.cpc.ncep.noaa.gov/products/international/trmm/trmm_Mar2016-Mar2016_sam_anom.gif)
Pakistan and surrounding region Above average rainfall, comes from ~18 stations. Other areas nearby that CHIRPS shows with above average rainfall are far northern India (~5 stations), Afghanistan (0 stations), and Jammu Kashmir (0 stations), and eastern Oman (~11 stations). Spatial extent can be attributed to CHIRP and to influence of stations mentioned above. Pakistan’s heavy rain was reported via reliefweb.int in early March in parts of Balochistan, with concerns of flash flooding. The storms continued into mid March across 6 provinces and led to flash floods, inland floods, and landslides that collapsed houses and other buildings. In the first half of March 121 people were killed and 127 were injured in Pakistan.
Balkan Peninsula countries Serbia, Montenegro, Macedonia, Bulgaria and Greece. CHIRPS shows above average rainfall (25 mm to 100 mm above average). Largest anoms were in Serbia and Montenegro. More than 50 stations reported the wet conditions across the region. According to Floodlist.com, heavy rainfall in early March created emergency situations in Serbia after flooding and landslides damaged homes and transportation links in central and eastern parts of the country. By the end of March over 1000 families received aid from the Red Cross.
Switzerland, Austria, and parts of Italy, Spain, and Portugal CHIRPS shows rainfall was 10 to 50 mm below average. Supported by ~50 stations in total and CHIRP.
Southeast Asia Above average rainfall in Indonesia indicated in CHIRPS was backed up by news reports of flooding [18].
Australia ~6 stations, especially in the west and all from the GHCN dataset, showed either zero or significantly lower values that surrounding stations, CHIRP, or weather reports.
Contributors: Emily Williams, South America; Laura Harrison, Europe and Central Asia; Libby White, Southeast Asia and Oceania.
February 2016
Rchecks highlights
Tajikistan, Kyrgyzstan, Uzbekistan, Afghanistan, Pakistan The general area around Tajikistan has very suppressed precipitation, with z-scored ranging from -1.5 to -3. Reports detail that this level of supressed rainfall may lead to a drought, impacting the water supply to neighboring countries [ http://www.azerbaijannews.net/index.php/sid/241799989]. The values are verieid by reports (ex/Dushanbe, Tajikistan at 7.40mm for hte month [ https://www.wunderground.com/history/airport/UTDD/2016/2/16/MonthlyCalendar.html?req_city=Dushanbe&req_statename=Tajikistan&reqdb.zip=00000&reqdb.magic=1&reqdb.wmo=38836]). 'Note: The decorrelation map has a strange V-like artifact over Tajikistan, which may be impacting the correlation of the stations.'
Indonesia & Malaysia Significant rainfall and flooding has been reported across Indonesia and Malaysia. Values have been verified by various reports [19] [20]. Some pixels in Indonesia show negative anomalies in a sea of positive anomalies (when working in anomaly space), but when the actual precip values are added up for the month at that station (ex//Semarang [21]), we find that the values are ok.
Philippines The Philippines are several months into a significant drought, backed up by reports [22].
Angola There is a large positive anomaly in Angola. The southern tip of it has a report of flooding [23]. Much of the rain fell in the last dekad of February, with the first two showing negative or no anomalies.
Madagascar The northern tip recieved 121mm of rain in one day [24]; 700,000 people in the south were impacted by the supressed rainfall, and 30,000 in the north by flooding [25].
Mozambique Large are of high precipitation in Zambezi region observed in CHIRPS that was not seen CHIRP product. It was determined that a nearby station perturbed the climatology which corresponded to a land surface elevation gradient.
Brazil and Argentina CHIRPS compared well, visually, with the monthly Met Services of each country.
South American CHIRPS Mean regional statistic hit a another new low for February which is consistent with the last 5 month.
January 2016
Rchecks highlights
Zimbabwe, Mozambique, Madagascar January CHIRPS shows large negative rainfall anomalies in these countries, on the order of 100-200 mm below average. These are more than 2 standard deviations from the mean in southern Madagascar, Tete province (Mozambaique), Mashonaland provinces (Zimbabwe), and Southeast province (Zambia). Enhanced dryness in these areas is part of a spatially large and persistent condition affecting southern Africa that is due to El Nino. See the Joint EC, FAO, FEWS NET and WFP Statement on El Niño Impact in Southern Africa
Tanzania, northern Mozambique, northern Madagascar CHIRPS reports wet anomalies of more than 100 mm. These were historically extreme (more than 2.5 standard deviations above the mean, in the ~98th percentile) in Mozambique's Cabo Delgado province and Tanzania provinces Mtwara, Lindi, and Morogoro. The largest anomalies were in Morogoro (+400mm) and areas in northern Madagascar including the Comoros Islands (150-300 mm). The very wet conditions is supported by 15+ stations. In Tanzania's Dodoma province heavy rain, strong winds, and flooding from 17-18 January destroyed 145 houses and affected 2,800 people. Previously, extreme wet conditions destroyed 1,500 homes in northern Mozambique. Due to the intensification of heavy rain in January, 5 fatalities occurred in Cabo Delgado province.
Gabon, Congo, and northern DRC CHIRPS shows rainfall as below average in January in western areas of central Africa. The estimates come from CHIRP and also ~12 stations in the area. NOAA's ARC2 data also reports a drier than normal January 2016 in this area.
More stations in Africa CHIRPS The station coverage has improved in southeast Africa. From November 2015 to January 2016 the number of reporting stations doubled in Botswana (7 to 14) and Zambia (8 to 17) and increased greatly in Angola (1 to 17). Improvements come from integration of the SASCAL dataset.
Brazil, Paraguay In central eastern and southern areas in Brazil and Paraguay CHIRPS reports wet anomalies of 100-150 mm and to +300 mm above average. More than 60 stations reported these conditions, in addition to CHIRP. According to FloodList more than 215,000 people were affected by flooding in January in Rio de Janiero, Mato Grosso, and Parana states (Brazil).
South America (northern/eastern and Amazon area) CHIRPS estimates January rainfall as being around 100mm below average from the Atlantic coast, through northern Brazil, and into southern Columbia. Some coastal zones of French Guinea show 200-300mm dry anomalies. The spatial pattern of dryness in CHIRPS is similar to what the satellite-based CHIRP data estimates, but the dry anomalies are also sourced from approximately 20 stations across the region (mainly in Brazil and to the east)
Columbia Columbia's Pacific coast area show very dry anomalies (200-400mm below average). Caution should be applied to the data in this zone as the anomalies are historically extreme (more than 2 standard deviations below the mean) but there are no stations reporting in the immediate area. Interesting effects seem to be coming from CHIRP and neighboring stations. Influence from neighboring stations is heavy in the southern section, as CHIRP shows above average in that area. Dryness in the northern section, which climatologically is drier, seems to come mainly from CHIRP.
Florida (US) and Cuba Extreme wet conditions in January in southern Florida and parts of Cuba. Rainfall was 100-250 mm above normal. The dense station coverage in the United States supports these estimates. Many areas experienced rainfall higher than the 95th percentile. Some areas broke records for January. In Fort Myers, FL for example it rained more than 8.5 inches in January (average is less than 2 inches). This followed their hottest Christmas on record.
California (US) January CHIRPS shows above average rainfall in northern California, with 50-150mm positive anomalies for most areas north of 35N. These estimates come from CHIRP and more than 40 stations. Depending on location rainfall ranged from the 68th to 90th percentile compared to previous January CHIRPS estimates.
Contributors: Laura Harrison (Africa, South America, Latin America, U.S.); 2/19/16
December 2015
Rchecks highlights
Zimbabwe Thus far into the 2015-2016 season, drought conditions have affected many countries of Southern Africa, including Angola, South Africa, Botswana, Zambia, Zimbabwe, Lesotho, Swaziland, and Mozambique. This was due to a delayed start and erratic distribution of rainfall since the start of the season in October. December rainfall was a key contributor to season total deficits in Zimbabwe. CHIRPS shows large rainfall deficits across the country ranging from 50 to 150 mm below the December average. The largest deficits are in central-eastern and northern Zimbabwe. There is high confidence in CHIRPS data in Zimbabwe due to agreement from 7 stations, CHIRP, and ARC2 in most areas.
Mozambique CHIRPS shows below average for most of the country, with anomalies in northern region of -15 to -75mm and larger deficits in the central and southern region (-75 to -150mm). The northern region dryness is in contrast to what NOAA’s ARC2 and RFE2 products show for December, which is above average rainfall (50-100 mm anomalies) in Cabo Delgado province. The CHIRPS dryness seems to be coming from CHIRP, and from influence of a station in northwest Mozambique. Another difference between CHIRPS and ARC2 is in central-southern Mozambique in southern parts of Manica and Sofala provinces. Here, ARC2 shows rainfall surplus and CHIRPS shows deficit. These deficits in Manica seem sourced mainly from CHIRP and from nearby Zimbabwe stations, as a GTS station in Manica did not report a large deficit. There is congruent evidence of very poor December rainfall in southern Mozambique, with reports of deficits from three stations and agreement with CHIRP and ARC2.
Zambia CHIRPS shows that most of Zambia, in particular the southern parts, experienced below average December rainfall. Ten of the twelve stations reporting to CHIRPS in Zambia reported deficits. The worst deficit reported was near Lusaka at 181 mm below average. Poor December rainfall may have exacerbated problems with food security that were previously identified in western, southern, and eastern areas. Overall, ARC2 and CHIRPS are not in agreement in Zambia. ARC2 shows above average conditions in northwest and north central provinces. Both products agree that southeast province was below average.
Tamil Nadu, India: CHIRPS continue to show the reported continued anomalous rainfall in southern India. However, rainfall was not as severe as November, and most rainfall seems to have occurred early in December. Two stations in and around Puducherry, south of Chennai, reported 200-500 mm above the average rainfall.
Kazakhstan/Northwest China: CHIRPS reported very wet conditions in Kazakhstan, especially near the border of China's Xinjian province. Rainfall appears to be two to three times the average, with one station on the border reporting six times the average rainfall. Seven stations in the area reported above average rainfall. CHIRP generally agreed with CHIRPS, but not to the extent of the station on the border. No news reports regarding especially heavy rainfall in the region were found.
Philippines CHIRPS shows the very wet conditions that occurred in the Philippines in December due to multiple major storms. Rainfall surpluses of 250 to 900mm are shown in the data. December totals along the east coast ranged from 650 to 1400mm. According to a report from Emergency Management, the rain was caused by a cold front, dragged into the country by Typhoon Nona (international name: Melor) and Tropical Depression Onyok, which hit the country in succession in mid-December. The December storms were responsible for at least 45 fatalities.
East Indonesia/Papua New Guinea CHIRPS shows large rainfall deficits that range from 150 mm to 300 mm below average for December. This area received only 30 to 70 percent of average December rainfall, based on the CHIRPs climatology. These conditions are consistent with those experienced for several months in the region. Drought and erratic rainfall here are linked with El Nino. Impacts through the end of 2015 were depletion of food sources and lack of water for household use. These problems have caused increased disease risk due to poor sanitation and use of non-sustainable coping mechanisms, such as households selling needed assets.
Southeast China Above average rainfall in southeast China is due to more than 25 station reports and also CHIRP satellite-based estimates. The wet conditions are linked to the series of major storms, including Typhoon Nona/Melor that moved through the Philippines and the South China Sea.
United States The Midwest and Southeast US continued with above normal rains creating flooding in the Midwest. CHIRPS captured this rainfall with large areas of the country in excess of 150 mm for the month.
Colombia A large region in the center of the country, "the blob", was estimated to have received above normal rainfall after station values were applied. There was no indication of the blob in the CHIRP data field. A group of station on the northeast end of the blob may have caused the creation of this above normal rainfall pattern. There is a group of three stations with very low values of 2 mm and then one 30km to the west with a higher reading of 179mm. We think there may be some effect of the autocorrelation field causing this pattern when there is a large differential between these to estimates. The pattern is seen in the previous three months but to a lesser extent. The pattern is not seen in previous years since these data contain many more stations in the region and wash out the effect. We will continue to investigate this phenomenon.
South America Paraguay, Brazil, Argentina, Urugay: Flooding in these four countries. Asuncion, Paraguay saw a lot of flooding shown in the r-checks file[[26]] ; South Brazil saw flooding [[27]]; these reports are backed up by TRMM [[28]].
![[28]](http://www.cpc.ncep.noaa.gov/products/international/trmm/trmm_Dec2015-Dec2015_sam_anom.gif)
Sao Paulo, Brazil: Report says that Sao Paulo received less than normal rain in December [[29]]; pre-station CHIRPS labels the area as wet, but station data backs up a negative anomaly, and CHIRPS did a good job of incorporating the station data to drive down the final CHIRPS value in the immediate area. This lack of rainfall for December is very localized.
Brazil: The northern parts of Brazil (part of the Amazon Basin) have been in a terrible drought in 2015, which has continued in December; this patterns is backed up by Brazil’s INMET [[30]].
Peru: Artifact of flooding in northern Peru backed up by reports [http://floodlist.com/america/heavy-rain-peru-landslides-floods]
Notes on CHIRPS in South America
Station artifacts: There are circular artifacts in Southern Brazil and Paraguay, similar to the ones seen in previous months (see November's "Recurrent CHIRPS Issues"); they seem to be station-driven as they don’t exist in CHIRP.
Regional statistics
- Global CHIRPS Maximum exceed 2200 mm for a new high for December. This is still under investigation.
- South American CHIRPS Mean hit a new low for December but this is in agreement with reports from the continent.
- Southern Africa CHIRPS Max hit a new low for December but this is in agreement with reports from the continent.
Contributors: Emily Williams (South America), Libby White w/Laura Harrison (Asia), Martin Landsfeld (U.S., Latin America, Statistics); 1/19/16
November 2015
Rchecks highlights
United States: CHIRPS shows the very wet conditions that occurred across the South and southern Midwest. November rainfall was 100-200 mm above average in northeastern Texas, eastern Oklahoma, Arkansas, Missouri, and in Georgia, North Carolina, and South Carolina. Monthly totals in Arkansas and Missouri were the highest on record in November 2015 (record dates to 1895). CHIRPS shows below average rainfall in coastal Oregon and coastal northern and southern California.
Mexico, Belize, Guatemala, El Salvador: The region encompassing the Yucatan Peninsula and south to the Pacific received heavy, above normal rainfall. A Guatemala station near the Caribbean Sea, Puerto Barrios, reported 680mm, which is 15 inches above normal. Reports from Guatemala explain that much of the heavy rain occurred in the second half of November. It led to dangerously high river levels and flooded communities in Alta Verapaz region. Flooding displaced thousands of people in Guatemala, Belize, and Mexico.CHIRPS also shows Panama as receiving above average rainfall.
Southern Africa: November CHIRPS shows widespread dryness across most of southern Africa, with anomalies of -30mm to -80mm. Some of the affected areas experienced below normal rainfall in October (South Africa, Zimbabwe, Mozambique, Angola). A below average rainfall season tends to occur in the region during El Nino conditions. The November dryness contributed to substantial season-to-date negative anomalies that pose a risk to cropping and pastoral activities.
Uganda, Kenya, Tanzania: November totals were 75mm to 150mm above average across most of Uganda and the Lake Victoria Basin. Similar magnitude anomalies occurred in other areas of southern Kenya and east and west Tanzania. The November wetness marks the second consecutive month month of anomalous rainfall in Uganda and west Tanzania, according to CHIRPS and the NOAA ARC2 product (Oct ARC2; Nov ARC2)
Qatar and Saudi Arabia: Areas received record rainfall in November, but CHIRPS did not pick it up. Qatar's Met Department reported a year's worth of rain in Doho (80mm) on Nov 25th. There were no Qatar stations reporting in CHIRPS. The satellite-based CHIRP product did not show sign of the wet events. There were several stations in Saudi Arabia reporting to CHIRPS in areas with reported flooding, but only one of them had a large anomaly (Hafr Al-Batin, at 90mm above normal). The influence of this particular station is not seen in the final CHIRPS product. Overall, CHIRPS shows a slightly wetter than average November in northern Saudi Arabia and no sign of the historic events noted here.
Southern Europe: CHIRPS shows below average rainfall across the region. Italy was particularly dry, with northern Italy at 150mm below average.
India: Exceptional amounts of rainfall were reported in southern India, and CHIRPS captured these anomalies well. Heavy rains occurred in areas that typically receive 150mm to 500mm in November, driving totals instead up to 2 times those amounts. The Chennai area received ~1000mm in November, according to news reports and to a GHCN-v2 monthly station that reported to CHIRPS. Some areas had the wettest November in 20 years.
East Asia: CHIRPS reported very wet conditions in southeast China, stretching from Guangi to the East China Sea coast near Shanghai. Anomalous wet conditions are also shown in Japan, South Korea, and the DPRK.
Indonesia: While most of Indonesia has below average rainfall values in November CHIRPS, there is an interesting rainfall dipole feature. Eastern Malaysia, Brunei, and western parts of Kalimantan, Indonesia show above average rainfall. The wetness is reported by multiple station observations and from CHIRP.
Brazil: Dryness persisted across the Amazon Basin in November. See October and September posts below. CHIRPS shows positive rainfall anomalies of ~100mm in areas of southeast Brazil (Sao Paulo and Rio de Janeiro). The wet November coincided with the collapse of a dam that released massive amounts of sludge and some toxic waste through the Rio Doce.
Recurrent CHIRPS issues
- Circular-shaped artifacts are seen in the data, anomalies, and z-scores of CHIRPS data in southern Brazil. These tend to be centered at station locations. The issue needs more evaluation, but the origin seems to be from the CHPclim, which has similar but smaller features in the region. These features may increase in size according to the spatial influence of stations.
- Coastal data artifact along North America's west coast. CHIRPS is generally a land-only product, but in some areas the coverage extends 1 to 3 pixels beyond the coastal boundary. Along the West Coast these pixels have lower climatological mean values than the data on land. This results in substantially different rainfall estimates and anomalies. The differences may be due to extension of coverage of the CHPclim based on TRMM, and should be examined further. In the meantime, CHIRPS users may want to consider clipping their data to coastal boundaries to remove the artifact.
Contributors: Laura Harrison; 12/21/15
October 2015
Rchecks highlights
United States: A storm complex that tapped into the moisture from Hurricane Joaquin off the south-eastern coast of the US hit the Carolina's, dumping 12-24 inches of rain (picked up in CHIRPS)[31]. Louisiana and Texas, in addition, were hit with the remnants of Hurricane Patricia, receiving a lot of rain (also visible in r-checks) [32].Finally, a dry-spell it the midwest showed up as well [33].
Mexico: Hurricane Patricia hit the south-west coast of Mexico, and rapidly downgraded, as shown in CHIRPS and backed up by FEWS early warning data [34]. Two stations however reported very low values (4 and 5 mm) along the northern border of Patricia's path. One of them, 400141, is blocked by mountains so might have a rain shadow. The other, 400984, however, is on the coast and is a station to keep an eye on. The path of Patricia can be seen here [35].
El Salvador, Honduras, and Nicaragua: The bay bordered by these three countries (where Choluteca is) has a very high station next to a low one. This is right where a severe gradient is that goes from high precipitation quickly to low. The mountains around this bay might act as a rain shadow. In El Salvador and Honduras, we see a similar pattern as the mountains block rain coming up from the south and a steep gradient occurs from high rain to very low.
Haiti: Haiti is showing a positive rain anomaly in the north west. While this area has been doing well, other reports show average instead of a positive anomaly. Might be good to keep an eye on it. [36]
![[36]](http://www.cpc.ncep.noaa.gov/products/african_desk/cpc_intl/camerica/Gonaives_Haiti_90day.gif)
East Africa: October CHIRPS is in general agreement with rainfall estimates from NOAA CPC ARC2 and RFE2 datasets in east Africa. Differences in magnitude occur in parts of Sudan and South Sudan, where CHIRPS estimates are approximately 30% lower than ARC2 and RFE. The products are all in agreement that October rainfall was above average in Sudan, South Sudan, and Uganda (CHIRPS, ARC2, and RFE2). The source of lower CHIRPS values may be (1) a drier climatology in October CHIRPS compared to ARC2 climatology and (2) features in the CHIRPS algorithm that lead to conservative estimates and low bias. Also, in an area of reported heavy rains with flooding (border of Ethiopia, Sudan, and South Sudan) there appears to be a drying influence of two GHCN-v2 stations in southeast Sudan used in CHIRPS- these reported low but reasonable values locally, but reduced the CHIRP estimate in the high rainfall area. Ethiopia contained 8 stations this month, a big improvement from the past few months.
West Africa: In October 2015, most of the station reports that contribute to CHIRPS in West Africa are from GHCN-v2, a source of monthly data that is highly ranked due to its quality control. CHIRPS compared well with CPC 30 day anomaly from the FEWS Hazards Report, 10/29/15, except in Guinea and Sierra Leone where CHIRPS is much drier.
South Africa: Stations between Lesthoso and Swaziland reported lower values than CHIRP estimated. The stations reduced the final CHIRPS which is in agreement with the FEWS Africa Hazards Report, 10/29/15, abnormal dryness polygon over the region.
Brazil: CHIRPS reports below average rainfall across much of the nation, with exception of heavy rainfall that occurred in Porto Alegre, Rio Grande do Sul state. Major flooding occurred in that area [37]. The rainfall deficits during October covered much of the Amazon rain forest and are highly concerning given the magnitude and persistence of drought conditions since 2014. The Amazon drought is reported as the worst in the past 80-100 years [38] and has created water shortages in major cities and rural areas [39][40]. Reality Checks monthly CHIRPS comparison identified the South America mean rainfall in September 2015 and October 2015 as being the driest since 1981, when the CHIRPS record began, and Brazil deficits play a major role in these continental scale deficits.
Asia: CHIRP did not perform well with Typhoon Mujigae, between Hong Kong and Hainan on Oct. 5-7th. The stations reported the precipitation amounts and CHIRPS estimates were increased in the area.
A GSOD station on northern border of Pakistan recorded 529 mm for the month. A neighboring station reported 179 mm. A news report claimed record rainfall in the area so we decided to keep the measurement.
Contributors: Laura Harrison (South America), Marty Landsfeld (Asia), Emily Williams (North and Central America, Hispanola), all-of-the-above and Shrad Shukla (Africa); 11/17/15
September 2015
Rchecks highlights
Vietnam: Tropical Storm Vamco brought a lot of rainfall to central/northern Vietnam/Laos/Thailand (300+ mm with flooding and fatalities). CHIRPS picked up significant rainfall in Northern Vietnamn (around Hanoi), but CHIRPS's pattern is a bit north of the reports. [41] [42]
China and Taiwan: Typhoon Dujuan brought torrential rainfall to Northern Taiwan and Eastern China; CHIRPS shows it in E. China but not much in Taiwan. [43] [44] Stations, though, seem to be reporting well so may be an interpolation problem with the climatology.
Japan: Lots of rain and flooding along Western coast and center [45].
Malaysia, Indonesia, Papua: Massive dry swaths; many large uncontrolled fires from slash-and-burn agriculture (could be good to keep an eye on for next month).
Columbia : Station in Cali, Columbia looks low but looked at previous months values and it looks fine. Diego confirmed it has been dry there in July and August. The rains are returning now he says. SQL commands: select * from precip_monthly4 where station_seqnum=20777 select * from precip_monthly4 where station_seqnum= 205576
Brazil : Near Sao Pablo all the stations are higher than CHIRP estimate. INMET rainfall map confirmed the higher values. Brazilian rainfall map can be found at: http://www.inmet.gov.br/portal/index.php?r=home2/index Click the Mapas de Precipitacao tab and then the Plus button at the bottom of the map and an end date and time period can be selected (30 dias).
*South America record rainfall deficit* : Station comparison graphs showed a very low CHIRPS mean for South America. /home/CHIRPS/diagnostics.etc/v2.0/marty/chirps.s_amer.stats.09.png But examining the CHIRPS didn’t reveal any errors in processing and given such a strong El Nino and the warm water in the eastern Pacific to the north, it we decided it was a real phenomenon. Also, stations in NW Brazil and Columbia verify the low precip values.
Ethiopia : Ethiopia contains only 3 stations. A special check was done on the contribution these stations had for CHIRPS data and anomalies. The 3 stations (2 were co-located) showed below average September rainfall and enhanced CHIRP deficits. As a result, CHIRPS September rainfall shows ~100 mm below average in Addis Ababa and Dire Dawa areas-- roughly 25% of average September rainfall. The CHIRPS September values were compared to data plotted with the Ethiopia Met Agency's MapRoom, which is described as being satellite estimates merged with ~600 stations for the country. Similar magnitude September 2015 anomalies are seen in CHIRPS and the Ethiopia data [46] for these areas. The stations were retained in CHIRPS.
Somalia, Uganda, Rwanda and Burundi: All had 0 stations reporting
Contributors: Emily Williams (Asia, Australia, Pacific Islands), Marty Landsfeld (South America, Africa), Laura Harrison (North and Central America, Africa); 10/19/15 - 10/23/15
August 2015
Rchecks highlights
North Korea: Removal of a GSOD station. DPRK experienced flooding associated with seasonal rains in early August, and from Tropical Cyclone Goni on 22-23 August, affecting South Hwanghae and North Hamgyong Provinces ([47],[48]) . The two GTS stations in the country are in these areas and reported heavy rains, which the CHIRPS reflects near these areas. GSOD stations (~12) in rest of the country report below average rain, making August an overall poor month for rain in DPRK. This has likely exacerbated the problems associated with late start to seasonal rainfall-- in June DPRK declared they were experiencing the 'worst drought in a century.' There have been major population impacts in the region, perhaps due to a combination of weather and political forces. Suggest removal of GSOD station #274228: Report is 9.19 mm in area with flooding. [49]
South Korea: CHIRPS dry anomaly confirmed. Stations show low August rainfall (verified by news reports), which has created an overall poor season there [50]. Makes North Korea dryness believable also.
China: Some cases of good stations not influencing CHIRPS local values. Saw several instances when neighboring stations swamped what looks like reasonable above average rainfall reports from some stations. Led to below average CHIRPS values in these areas. Examining monthly decorrelation distance maps may help identify scope of problem.
Ghana: Concern about station reports and conditions. Several stations reported 0-10 mm in August. These had some influence on CHIRPS. Were deemed ok stations as they had reasonable values in earlier months and seasonal rains have been below average due to active ITCZ enhanced rains in an abnormally northern position. Note: In July 2015 Ghana had only 1 reporting station in CHIRPS, as compared to 5-13 in other months.
Ethiopia: Exceptional dryness identified by ranked z scores. Z score=-2.6, station value=160 mm, Ethiopia highlands (10.33N, 37.740E). Determined CHIRPS value in area was representative of conditions. Also that this is an area of potential concern that needs highlighting on Hazards report-- GeoWRSI shows crops were in reproductive phase in August; Prelim CHIRPS shows September 1-10 was below average; ARC2 shows below average thru September there also.
India: Incorrect wet anomaly in northern India. India's Met Department shows below average ([51]), but CHIRPS shows strongly above average. Due to combination of: 0 India stations in area + very wet observation in NE Pakistan (verified by reports) + wet station in China + CHIRP shows wet anomaly. Otherwise, CHIRPS correctly identified August rainfall deficits across most of India and surplus in Bhutan.
![[51]](http://www.imd.gov.in/section/hydro/dynamic/rfmaps/monthly/aug2015.jpg)
Chile: Atacama desert, possible problem. Reports say significant rain in Atacama desert ([52] ,[53]) , which rounds to 15 mm instead of 5; CHIRPS isn’t really picking it up as it’s a very fine difference, but as that area is a desert area, that small increase in rainfall resulted in massive flooding and evacuation. CHIRPS showed significant precipitation inland of Concepcion, which agrees with rain and snow reports ([54]). Santiago: CHIRPS wet anomaly confirmed. Report ([55]) details increased rain, which is showing up in CHIRPS.
Uruguay: CHIRPS wet anomaly confirmed. CHIRPS recorded above average rainfall for Uruguay for August 2015. The rainfall throughout the country, according to CHPClim, tends to be between 60 and 90 mm; however, CHIRPS reported it ranging from 190 to 240 mm, with the south-eastern coast receiving between 300 and 340mm for the month. This increase in rainfall is backed up by reports, including one from “floodlist” ([56]).
Burkina Faso (added 9/23/15): Station near capital (Ouagadougou) flooded in August, but CHIRPS didn’t pick it up. However, CHIRPS did pick up the rest of the flooding in the country.
Notes on Rchecks resources
Regarding the rchecks-2.files: Reminder - The zscores in rchecks-2.files are not station zscores. They are zscores of CHIRPS data that has been placed at that station's pixel. Using the zscores in these files is helpful for identifying extreme CHIRPS that are caused by extreme station values. Using the zscores is not helpful for identifying stations that do not have influence much on CHIRPS BUT give bad reports (had concerns about this for some stations in Ghana, see above). We discussed routinely isolating a value that indicates this, so that we know which stations have issues. Basically we would do a sorting of the country information based on this value, like we do with the zscores (check.txt). Something to look into more. Also, we corrected a bug that limited the number of recheck text files. Now should have all countries.
Contributors: Laura Harrison, Marty Landsfeld, Emily Williams; 9/17/15
July 2015
Rchecks highlights
Ethiopia: July’s r-check had quite a few high z-scores. Upon analysis, these discrepancies were coming from the highlands, near Addis Ababa, and south of Addis Ababa.
Station (10.33, 37.74; in town of Debre Markos) reported much lower than CHIRP and CHPClim, in the same way it reported low for August 2015. Station (8.86, 39.92; in town of Metehara Merti, near Addis Ababa) also reported much lower than CHIRP and CHPClim. ARC2 tells a similar story; ARC2 dictates the area having received 200-300mm[57]. ARC2’s anomaly map for July also roughly matched CHIRPS’ anomaly map, at a decrease of around -200m of normal[58].
One report stated “July’s seasonal rains did not come this year…” , while another confirmed that "the rain condition was ok for the first ten days during the month of June. It gradually declined and we started experiencing shortage in rain in July. But conditions are good in August…it has occurred several times in the past, including in 2005.”. The July rains (that didn’t come this year) tend to climb north-east across the highlands throughout June, July and August, the area showing a shortage in rain. It seems the stations are correct and Ethiopia experienced a drought this summer. However, due to the decreased number of stations since August 2014, it is possible that these stations are overestimating the level of drought.
![[57]](http://www.cpc.ncep.noaa.gov/products/african_desk/cpc_intl/cf_test2/africa_arc/africa_arc_Jul2015-Jul2015_af_clim.gif)
![[58]](http://www.cpc.ncep.noaa.gov/products/african_desk/cpc_intl/cf_test2/africa_arc/africa_arc_Jul2015-Jul2015_af_anom.gif)
Sudan: CHIRPS and CHIRP both indicate that in southwest Sudan, June was had normal rainfall, July was dry, and August returned to normal rainfall (aka summer rains came late). The proximity of the area to the Ethiopian highlands means it followed similar trends as seen in Ethiopia, as backed up by previous reports. HOWEVER, CHIRPS completely missed mass flooding in Darfur in July[59]; for that same time of mass flooding, CHIRPS reported a decrease in rainfall.
Burkina Faso: We may have a faulty station (or stations) in northeast Burkina Faso. The two stations are located at (14.03, -0.033; stn 277004); one reported 482 mm of rain, CHIRP reported 129, and CHPClim 117; the other station seems to bring the number ranges from 0-10. These stations combined, though, are driving up the CHIRPS rainfall estimates.
One report does state that regular rain started mid-July [60]. However, most reports indicate that the northeastern area had decreased, not increased, rainfall in July [61]; NOAA/FEWS NET reports for July show dryness as well in the west and southwest [62] [63] [64] [65] [66].
Guatemala: CHIRPS is fairly accurately picking up a drought in Guatemala, but may be overestimating it in some areas. Station (-88.59, 15.74) has a high value (154) compared to CHIRP (104), and yet CHIRPS is drug down for that pixel (84). There is a neighboring station in Honduras that has an extremely low station value that is most likely over-influencing CHIRPS, creating exaggerated estimates of low rainfall for Guatemala. Reports confirm the drought's severity: TRMM (anomaly and time series) shows drought in the north and west of the nation (-100- -200), in concurrence with CHIRPS (-200- - 300), and written articles confirm the precip data [67] [68]. CHIRPS is picking up the drought around El Salvedor and in southern Honduras, but again might be overestimating the drought in Guatemala.
Flooding occurred in July in Chinaulta (southeast) ; CHIRP and TRMM both reported higher than average rainfall in that area, but CHIRPS reported higher rainfall only along the coast and drought in Chinaulta. The underestimation of precipitation by CHIRPS might again be the influence of the station in the north of Honduras. It seems that stations are having too high an influence, especially when they are all reporting the same phenomenon and are then influencing another with the opposite (ex//drought all around, but flooding in Chinaulta).
Honduras: see above
CHIRPS shows a more extreme drought in the West than CHIRP shows, but TRMM reports similarly, suggesting CHIRPS is accurately reporting the drought and CHIRP underestimated it[69].
![[69]](http://www.cpc.ncep.noaa.gov/products/fews/central_america/anomalies/anomzoom_07.gif)
Contributors: Emily Williams; 9/23/15 - 9/24/15
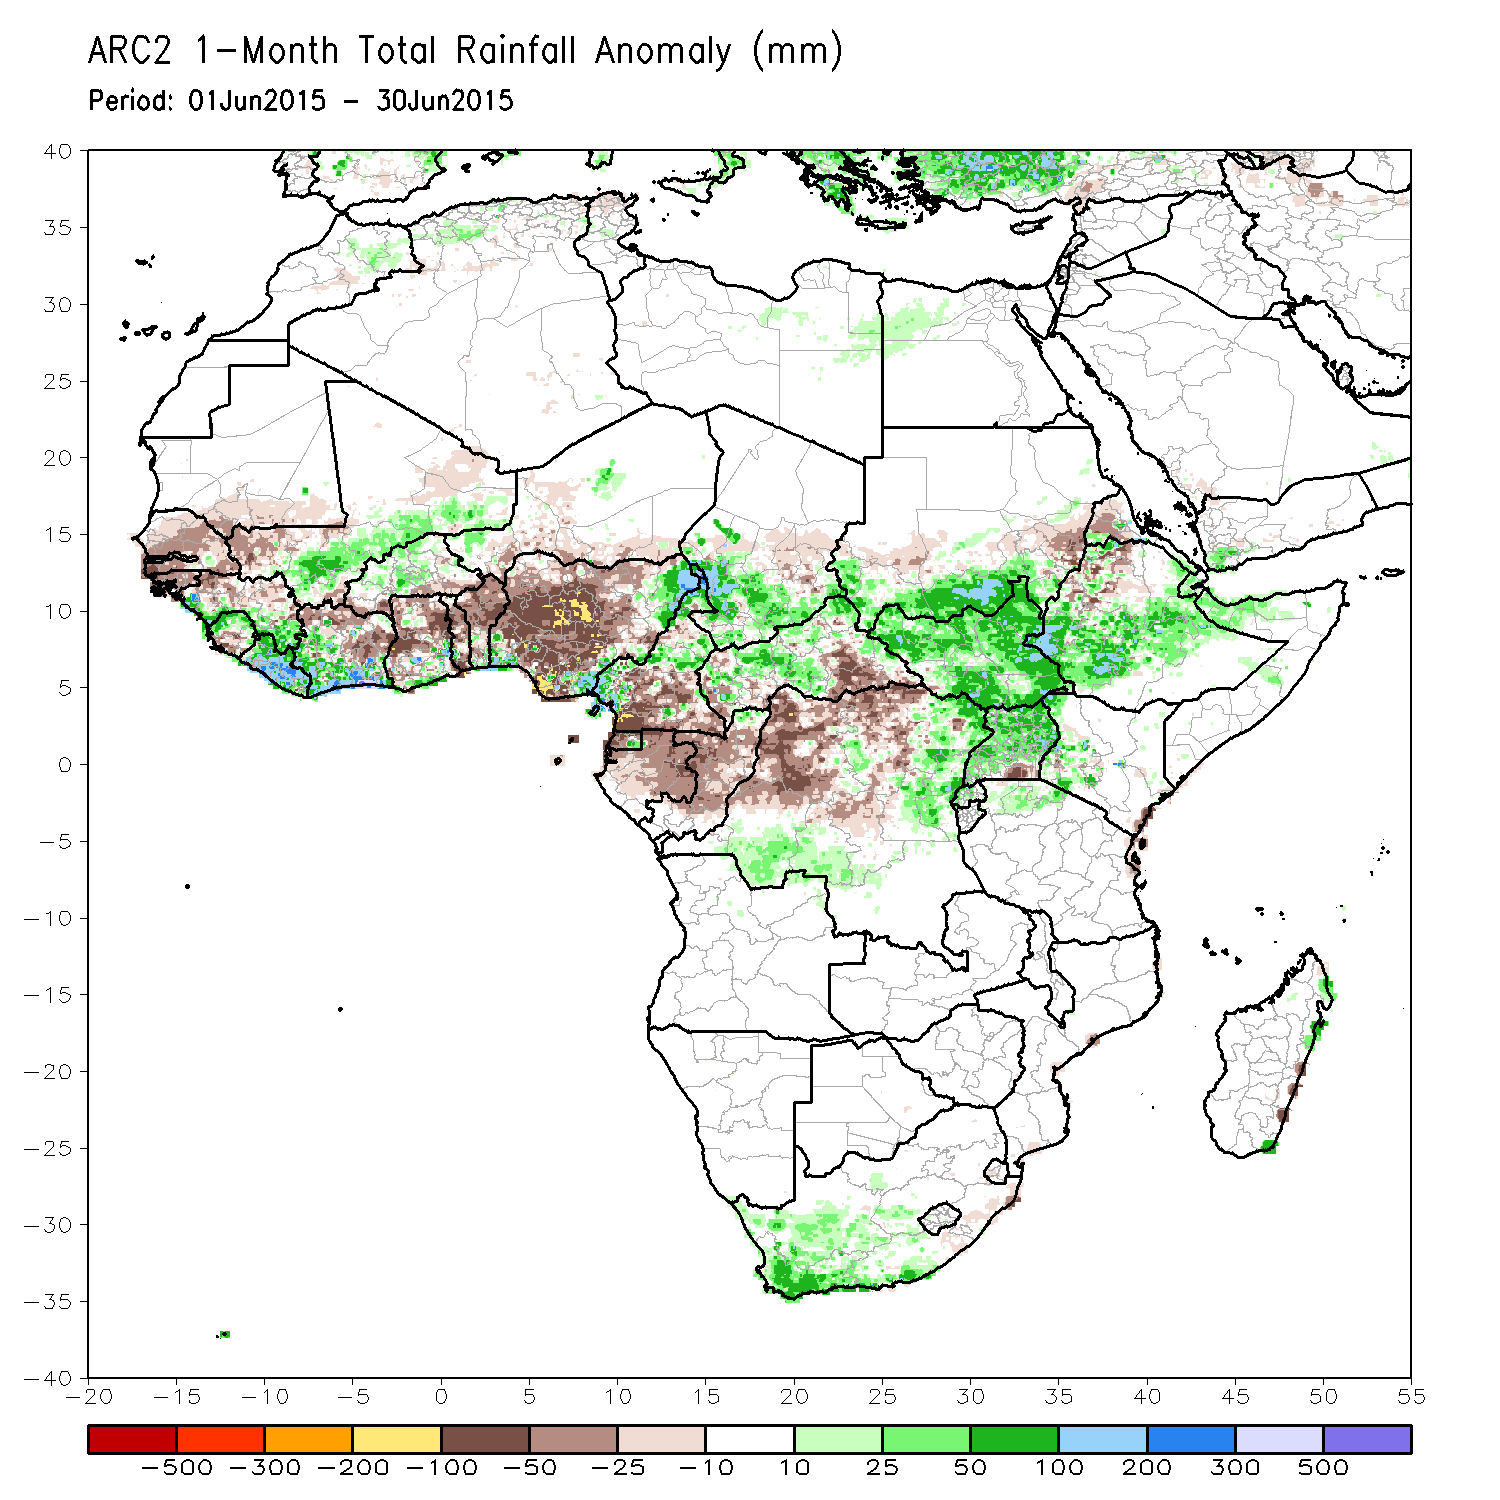
June 2015
Rchecks highlights
Honduras: CHIRPS reported Honduras having experienced flooding around the capital and the northern Caribbean coast. The flooding in the center was backed up by reports. However CHIRP reporting higher rainfall than the stations. Mid-June, Hurricane Bill formed along Honduras's northern coast, which could account for the flooding. However, NOAA/FEWS does not report any flooding, and in fact reports dryness along the Southwest of the country.
Nicaragua: CHIRPS picked up some significant rainfall (anomaly of +30-50mm) along Western Nicaragua. It was confirmed that the flooding seen in CHIRPS is roughly the pattern of flooding experienced on the ground [70]. NOAA/FEWS did not pick up this flooding in their reports [71].
Costa Rica: Costa Rica similarly experienced significant flooding in much of the country, also missed by NOAA/FEWS. However, it was picked up by TRMM.
Ethiopia: CHIRPS reporting lower-than-average rainfall for Ethiopia's highlands, which seems to be in line with the summer's drought. Compared to ARC1 estimates, CHIRPS might be overestimating the drought at this point, but it is nonetheless present. NOAA/FEWS have not captured the severity and distribution, and even declared "no drought" in Ethiopia at the end of June [72].
Kenya: Flooding in Nairobi that CHIRPS didn't catch [73]. Other general trends in climate are echoed by ARC1 [74]. There is a station in the southeast of Kenya (in the town of Mombasa) which reported a higher-than-average value for CHIRPS, but a low station value; this same area was subject to flooding [75].
In May, flooding in Mombasa, picked up by CHIRPS [76].
Madagascar: CHIRPS reporting higher-than-average rainfall along Madagascar's eastern coastline.
Senegal: One station is reporting an abnormally low value (7mm) for June, when CHIRP puts it around 100mm. However, Arc2 shows a decline in rainfall for that area in June [77]. The station looks okay for other months; may be good to keep an eye on though.
![[77]](http://www.cpc.ncep.noaa.gov/products/african_desk/cpc_intl/cf_test2/africa_arc/africa_arc_180day_ptts_Saraya_Senegal.gif)
Mali: Station reporting a low value (99) in an area that tends to get 127; CHIRPS is reporting 139 for this area. The area is on the slope of a mountain, though, and on a rain gradient, so it's likely that the station is correct.
Ghana: CHIRPS failed to pick up flooding in coastal town of Accra during "biggest storm in the past 20 years". The station failed to pick it up, which is probably why CHIRPS didn't get it (station said 154mm, while the report said 250 mm in only the first 3 days.
Contributors: Emily Williams; 9/28/15
May 2015
Rchecks highlights
Guatemala: There is a station in the far east of Guatemala which is reporting a significantly high rainfall value, but CHIRPS is reporting a value closer to CHIRP and CHPClim. There is, however, a station very near in Honduras which has an extremely low value which could be over-influencing CHIRPS at our station's location.
TRMM total rainfall anomolyis reporting lower-than-average rainfall for that period of time, but then a positive anomaly for June which aligns with our station.
However, TRMM's total rainfall time series from station values agrees with our station that is reporting higher rain[78], and disagrees with the Honduras station.
![[78]](http://www.cpc.ncep.noaa.gov/products/african_desk/cpc_intl/camerica/PuertoBarrios_Guatemala.gif)
Honduras: The most notable station this month has a value of 1 in the North West of the country. However, the country as a whole had an anomaly of 100-200mm, lining up with TRMM values. The station is in a valley surrounded by mountains so it might be correct in that it received no rainfall there, but is something to keep an eye on.
Tajikistan: CHIRPS to picked up flooding in the Khatlon province of Tajikistan [79].
Kenya: CHIRPS is showing a high quantity of rain along the southern coast and boarder of Kenya. The ARC2 time series points up this claim, in addition to the estimates. Additionally, the RFE anomaly backs up the claim of high rainfall in the south, and low in the northwest [80].
Tanzania: CHIRPS and ARC2 both show an high positive anomaly of rain in Tanzania in the SE [81]. The RFE for the end of the month shows a negative anomaly for the same area [82], but a positive anomaly for the beginning [83]. Reports of flooding back up this claim [84].
![[81]](http://www.cpc.ncep.noaa.gov/products/african_desk/cpc_intl/cf_test2/africa_arc/africa_arc_May2015-May2015_af_anom.gif)
Uganda: CHIRPS shows dryness through much of the country except for a high incidence of rain in the south near the lake. RFE and ARC2 show similar trends. ARC2 time series shows both the dryness just north of the lake (in correspondence with the low station value) and then the wetness to the west of the lake [85]. CHIRPS is correct for May.
![[85]](http://www.cpc.ncep.noaa.gov/products/african_desk/cpc_intl/cf_test2/africa_arc/africa_arc_180day_ptts_Masaka_Uganda.gif)
Madagascar: Dry station on east (central/north) coast; ARC2 time series shows same dryness [86]; ARC2 month shows the same [87]. However, CHIRPS showing a lot of wetness along the rest of the eastern coast, but not backed up by ARC2. It seems like the coastal stations have been overreporting rainfall for May-July. ARC2 timeseries and month-estimates, RFE, and reports [88] show less rainfall than CHIRPS.
![[86]](http://www.cpc.ncep.noaa.gov/products/african_desk/cpc_intl/cf_test2/africa_arc/africa_arc_180day_ptts_Toamasina_Madagascar.gif)
Burkina Faso: Country received high rainfall in West according to RFE and ARC2 [89] [90]. Station in CHIRPS shows the same story; however CHIRP is showing dryness across the country. ARC May estimates agree there should be more rainfall in the West. Seems like this station is being drowned out by dry stations and should have a higher influence on the area to make it come up as wet instead of dry/average.
![[89]](http://www.cpc.ncep.noaa.gov/products/african_desk/cpc_intl/cf_test2/africa_arc/africa_arc_180day_ptts_BoboDioulasso_Burkina.gif)
Mali: Station in south of country shows wet values but is also being drowned out by surrounding drought area, making the area look average instead of wet.
April 2015
Rchecks highlights
Cote D'Ivoire and Ghana: CHIRPS is struggling again to pick up anomalous wet periods when surrounded by dry areas. There were stations reporting wet values surrounded by stations reporting dry values, and CHIRPS didn't allow for the high value to significantly impact the area around it; RFE [91] and ARC [92] both indicate wetness for the southern part of the country, which CHIRPS under-reports.
![[92]](http://www.cpc.ncep.noaa.gov/products/african_desk/cpc_intl/cf_test2/africa_arc/africa_arc_Apr2015-Apr2015_af_anom.gif)
Eastern Africa: CHIRPS did a good job in picking up the significant wetness stretching along the Eastern coast of Africa. ARC and CHIRPS are in agreement, where RFE is reporting much drier conditions throughout Kenya and parts of Tanzania.
Kenya Kenya was fairly wet in August. RFE and ARC show wet conditions in northern and western Kenya, though drier conditions in southern and eastern Kenya. CHIRPS isn't picking up the dryness. All the z-scores that stood out, however, are for stations that reported lower rainfall values than CHIRPS shows. Seems CHIRPS isn't heeding local station signals enough and relies too strongly to influences of surrounding precipitation conditions.
Honduras: There is a station that received nearly zero rain in April, but this is backed up by the RFE time series points.
Dominican Republic: CHIRPS picked up that very little rain fell along the northern and eastern coasts of the Dominican Republic.
Tajikistan: CHIRPS shows lower-than-average rainfall in north along ridgeline, and higher-than-average rainfall in the western-central portion of the country. Stations are reporting higher values for rain than the weather records [93] (130 vs 71). Difficult to verify if CHIRPS is accurately reporting or not due to limited precipitation data to compare with. Would be good to have NOAA's RFE png blown up a bit to see better whether our results correlate [94].
Contributors : Emily Williams, 10/16/15